
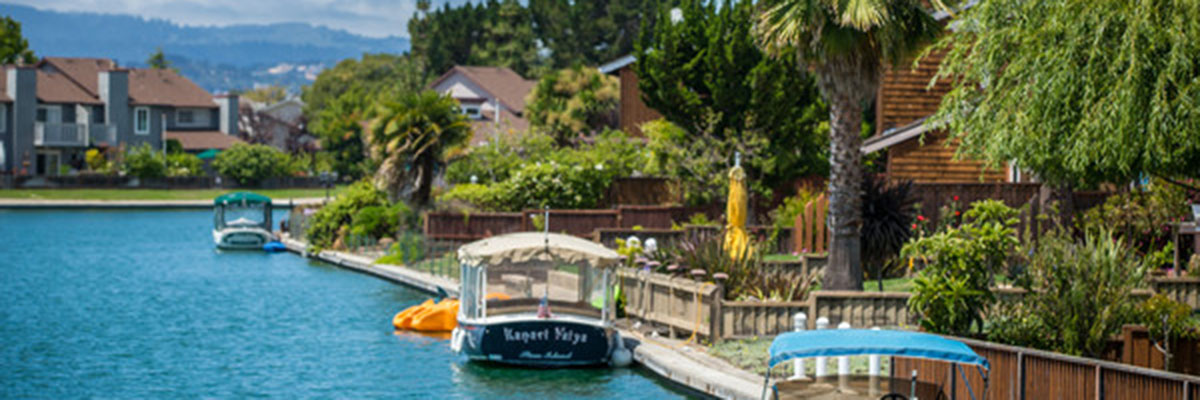
Located on prime land that was first acquired by T. Jack Foster & Sons in 1960, the city of Foster City is one of the nation’s shining examples of a highly successful planned community. Boasting 223 miles of waterways, 13 miles of shoreline, and 12 residential islands, Foster City is home to spectacular waterfront properties and magnificent residential developments as well as luxurious condominiums, townhouses, and apartment complexes.
The community enjoys a prime location midway between San Francisco and San Jose, just 10 minutes from the San Francisco International Airport, and adjacent to the San Mateo Bridge serving the East Bay communities. A thriving retail industry includes beautiful shopping centers like Beach Park Plaza, Charter Square, Edge Water Place, Marlin Cove, Market Place, and the Port O’Call. An active parks and recreation department has resulted in first-rate facilities like bike paths, dog exercise areas, vast acres of parkland, lighted athletic fields and tennis courts, picnic areas, par courses, and a wildlife refuge.
Foster City
Municipal Offices
650-286-3200
www.fostercity.org
Chamber of Commerce
650-573-7600
www.fostercitychamber.com
FC- Nbrhood#1 - Treasure Isle Et (30-day trend) Number of PropertiesAvg PriceAvg $/SQFTAvg DOM% of Avg Sold Price/Avg List PriceActive4 (Number of Properties)$1,882,341 (Avg Price)$902 (Avg $/SQFT)44 (Avg DOM)Sold2 (Number of Properties)$1,647,338 (Avg Price)$945 (Avg $/SQFT)53 (Avg DOM)102% (% of Avg Sold Price/Avg List Price)FC- Nbrhood#2 - Bay Vista (30-day trend) Number of PropertiesAvg PriceAvg $/SQFTAvg DOM% of Avg Sold Price/Avg List PriceActive1 (Number of Properties)$2,505,259 (Avg Price)$1,125 (Avg $/SQFT)5 (Avg DOM)Sold3 (Number of Properties)$2,169,506 (Avg Price)$1,088 (Avg $/SQFT)36 (Avg DOM)111% (% of Avg Sold Price/Avg List Price)FC- Nbrhood#3 - Carmel Village E (30-day trend) Number of PropertiesAvg PriceAvg $/SQFTAvg DOM% of Avg Sold Price/Avg List PriceActive1 (Number of Properties)$1,974,121 (Avg Price)$895 (Avg $/SQFT)8 (Avg DOM)Sold2 (Number of Properties)$1,732,857 (Avg Price)$1,115 (Avg $/SQFT)35 (Avg DOM)110% (% of Avg Sold Price/Avg List Price)FC- Nbrhood#4 - Marina Point Etc (30-day trend) Number of PropertiesAvg PriceAvg $/SQFTAvg DOM% of Avg Sold Price/Avg List PriceActive1 (Number of Properties)$947,536 (Avg Price)$701 (Avg $/SQFT)6 (Avg DOM)Sold0 (Number of Properties)$898,440 (Avg Price)$634 (Avg $/SQFT)34 (Avg DOM)102% (% of Avg Sold Price/Avg List Price)FC- Nbrhood#5 - The Islands Etc (30-day trend) Number of PropertiesAvg PriceAvg $/SQFTAvg DOM% of Avg Sold Price/Avg List PriceActive6 (Number of Properties)$2,062,382 (Avg Price)$1,007 (Avg $/SQFT)19 (Avg DOM)Sold2 (Number of Properties)$1,725,420 (Avg Price)$1,033 (Avg $/SQFT)26 (Avg DOM)106% (% of Avg Sold Price/Avg List Price)FC- Nbrhood#6 - Harbor Side Etc. (30-day trend) Number of PropertiesAvg PriceAvg $/SQFTAvg DOM% of Avg Sold Price/Avg List PriceActive3 (Number of Properties)$1,674,388 (Avg Price)$978 (Avg $/SQFT)14 (Avg DOM)Sold3 (Number of Properties)$1,991,351 (Avg Price)$1,177 (Avg $/SQFT)45 (Avg DOM)102% (% of Avg Sold Price/Avg List Price)FC- Nbrhood#7 - Sea Colony Etc. (30-day trend) Number of PropertiesAvg PriceAvg $/SQFTAvg DOM% of Avg Sold Price/Avg List PriceActive1 (Number of Properties)$2,398,727 (Avg Price)$1,131 (Avg $/SQFT)2 (Avg DOM)Sold1 (Number of Properties)$2,317,205 (Avg Price)$1,122 (Avg $/SQFT)30 (Avg DOM)110% (% of Avg Sold Price/Avg List Price)FC- Nbrhood#8 - Dolphin Bay Etc. (30-day trend) Number of PropertiesAvg PriceAvg $/SQFTAvg DOM% of Avg Sold Price/Avg List PriceActive0 (Number of Properties)$2,450,000 (Avg Price)$1,038 (Avg $/SQFT)4 (Avg DOM)Sold1 (Number of Properties)$2,166,666 (Avg Price)$1,692 (Avg $/SQFT)30 (Avg DOM)112% (% of Avg Sold Price/Avg List Price)FC- Nbrhood#9 - Isle Cove Etc. (30-day trend) Number of PropertiesAvg PriceAvg $/SQFTAvg DOM% of Avg Sold Price/Avg List PriceActive1 (Number of Properties)$1,442,230 (Avg Price)$935 (Avg $/SQFT)4 (Avg DOM)Sold1 (Number of Properties)$1,677,000 (Avg Price)$1,029 (Avg $/SQFT)26 (Avg DOM)109% (% of Avg Sold Price/Avg List Price)FC-Nbrhood#10 - Metro Center Etc (30-day trend) Number of PropertiesAvg PriceAvg $/SQFTAvg DOM% of Avg Sold Price/Avg List PriceActive4 (Number of Properties)$1,182,630 (Avg Price)$764 (Avg $/SQFT)26 (Avg DOM)Sold1 (Number of Properties)$1,309,562 (Avg Price)$855 (Avg $/SQFT)31 (Avg DOM)102% (% of Avg Sold Price/Avg List Price)
Property Info


