
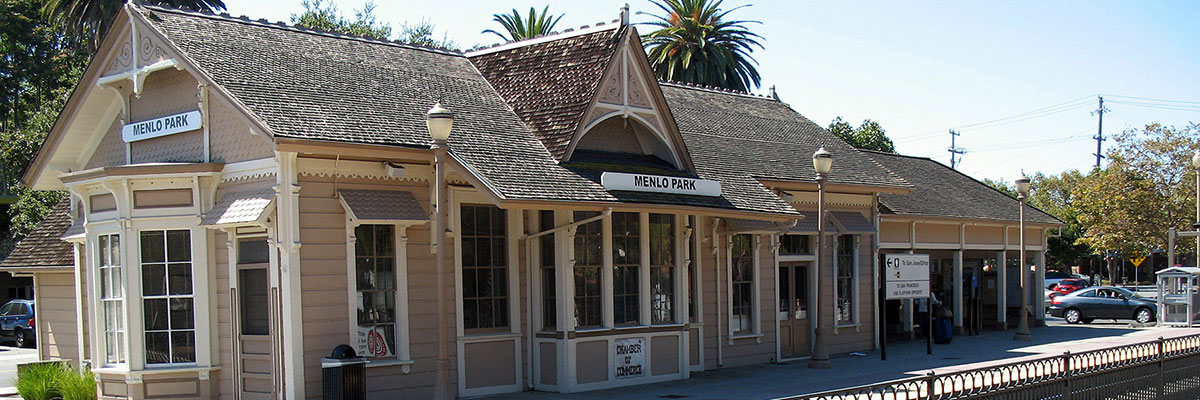
Harmonizing the romantic history of another century with valuable contributions to modern technology, Menlo Park is a delightful blend of the old and new. In fact, the chamber of commerce selected a home in the 1867 Menlo Park Train Station, distinguished as the oldest station building in continuous use. However, even the celebrated architecture and antiques from yesterday are meticulously maintained in this exceptionally beautiful community. Located about 30 miles from San Francisco, Menlo Park is approximately 20 miles from San Jose and 30 miles from the Pacific Ocean.
Known as the “City of Parks,” the community maintains lush parkland in a 20-mile radius offers opportunities for tennis, softball, soccer, archery, swimming, camping, softball, basketball, lawn bowling, hiking, and picnicking. Primarily a city of handsome homes and luxurious condominiums, the community’s proximity to Stanford University has resulted in a proliferation of impressive light industry and high-tech facilities that include the Nobel-Prize-winning research center of Stanford Linear Accelerator.
Menlo Park
Municipal Offices
650-330-6600
www.ci.menlo-park.ca.us
Chamber of Commerce
650-325-2818
www.menloparkchamber.com
Alpine Road Area (30-day trend) Number of PropertiesAvg PriceAvg $/SQFTAvg DOM% of Avg Sold Price/Avg List PriceActive0 (Number of Properties)$2,786,125 (Avg Price)$1,032 (Avg $/SQFT)9 (Avg DOM)Sold1 (Number of Properties)$2,940,000 (Avg Price)$1,225 (Avg $/SQFT)40 (Avg DOM)99% (% of Avg Sold Price/Avg List Price)East of U.S. 101 (30-day trend) Number of PropertiesAvg PriceAvg $/SQFTAvg DOM% of Avg Sold Price/Avg List PriceActive1 (Number of Properties)$1,182,491 (Avg Price)$1,231 (Avg $/SQFT)70 (Avg DOM)Sold0 (Number of Properties)$1,361,578 (Avg Price)$1,185 (Avg $/SQFT)33 (Avg DOM)110% (% of Avg Sold Price/Avg List Price)Central Menlo (30-day trend) Number of PropertiesAvg PriceAvg $/SQFTAvg DOM% of Avg Sold Price/Avg List PriceActive6 (Number of Properties)$6,394,015 (Avg Price)$1,816 (Avg $/SQFT)28 (Avg DOM)Sold5 (Number of Properties)$5,142,452 (Avg Price)$1,786 (Avg $/SQFT)37 (Avg DOM)100% (% of Avg Sold Price/Avg List Price)Felton Gables (30-day trend) Number of PropertiesAvg PriceAvg $/SQFTAvg DOM% of Avg Sold Price/Avg List PriceActive0 (Number of Properties)Flood Park Area (30-day trend) Number of PropertiesAvg PriceAvg $/SQFTAvg DOM% of Avg Sold Price/Avg List PriceActive1 (Number of Properties)$2,673,500 (Avg Price)$1,284 (Avg $/SQFT)6 (Avg DOM)Sold2 (Number of Properties)$2,215,857 (Avg Price)$1,605 (Avg $/SQFT)31 (Avg DOM)105% (% of Avg Sold Price/Avg List Price)Middlefield to El Camino (30-day trend) Number of PropertiesAvg PriceAvg $/SQFTAvg DOM% of Avg Sold Price/Avg List PriceActive8 (Number of Properties)$2,283,452 (Avg Price)$1,177 (Avg $/SQFT)16 (Avg DOM)Sold0 (Number of Properties)$2,045,873 (Avg Price)$1,159 (Avg $/SQFT)74 (Avg DOM)99% (% of Avg Sold Price/Avg List Price)Allied Arts / Downtown (30-day trend) Number of PropertiesAvg PriceAvg $/SQFTAvg DOM% of Avg Sold Price/Avg List PriceActive8 (Number of Properties)$3,657,360 (Avg Price)$1,677 (Avg $/SQFT)85 (Avg DOM)Sold3 (Number of Properties)$1,945,520 (Avg Price)$1,325 (Avg $/SQFT)22 (Avg DOM)102% (% of Avg Sold Price/Avg List Price)County Area / Fair Oaks Ave (30-day trend) Number of PropertiesAvg PriceAvg $/SQFTAvg DOM% of Avg Sold Price/Avg List PriceActive4 (Number of Properties)$2,415,941 (Avg Price)$1,096 (Avg $/SQFT)14 (Avg DOM)Sold4 (Number of Properties)$1,532,217 (Avg Price)$1,369 (Avg $/SQFT)28 (Avg DOM)110% (% of Avg Sold Price/Avg List Price)Menlo Oaks Area (30-day trend) Number of PropertiesAvg PriceAvg $/SQFTAvg DOM% of Avg Sold Price/Avg List PriceActive3 (Number of Properties)$5,202,474 (Avg Price)$1,800 (Avg $/SQFT)16 (Avg DOM)Sold1 (Number of Properties)$3,700,000 (Avg Price)$1,288 (Avg $/SQFT)87 (Avg DOM)97% (% of Avg Sold Price/Avg List Price)County / Alameda Area (30-day trend) Number of PropertiesAvg PriceAvg $/SQFTAvg DOM% of Avg Sold Price/Avg List PriceActive13 (Number of Properties)$4,195,656 (Avg Price)$1,479 (Avg $/SQFT)30 (Avg DOM)Sold4 (Number of Properties)$4,270,581 (Avg Price)$1,671 (Avg $/SQFT)55 (Avg DOM)100% (% of Avg Sold Price/Avg List Price)Sharon Heights / Stanford Hills (30-day trend) Number of PropertiesAvg PriceAvg $/SQFTAvg DOM% of Avg Sold Price/Avg List PriceActive13 (Number of Properties)$4,114,217 (Avg Price)$1,350 (Avg $/SQFT)18 (Avg DOM)Sold2 (Number of Properties)$2,167,659 (Avg Price)$991 (Avg $/SQFT)54 (Avg DOM)98% (% of Avg Sold Price/Avg List Price)Willows / O'Conner Area (30-day trend) Number of PropertiesAvg PriceAvg $/SQFTAvg DOM% of Avg Sold Price/Avg List PriceActive2 (Number of Properties)$3,370,291 (Avg Price)$1,641 (Avg $/SQFT)11 (Avg DOM)Sold3 (Number of Properties)$3,214,752 (Avg Price)$1,565 (Avg $/SQFT)48 (Avg DOM)115% (% of Avg Sold Price/Avg List Price)
Property Info


